Cluster Heatmap
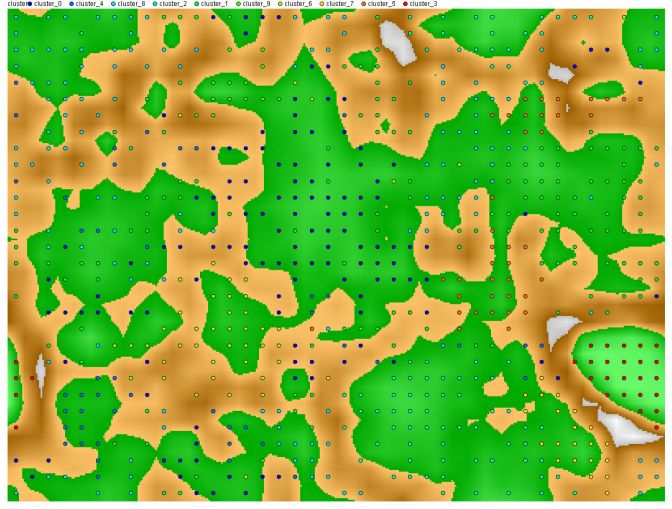
To show the result of a SOM clustering, a landscape type visualization is used in most cases. Reducing the high dimensional vector space of the document collection to two dimensions, nonlinearities appear, resulting in a scale which is position dependent. To show this, a landscape is shown. Here "mountains" have the meaning of "greater distance between two points" and valleys have the meaing of "smaller distance between two points". Documents are shown as points within this landscape (in most cases there is no possibility to see if there is more than one document at a certain location). Individual words are often plotted on this landscape to give an impression about the topics at a certain location. The landscape is static. Nice to see, but useless ...
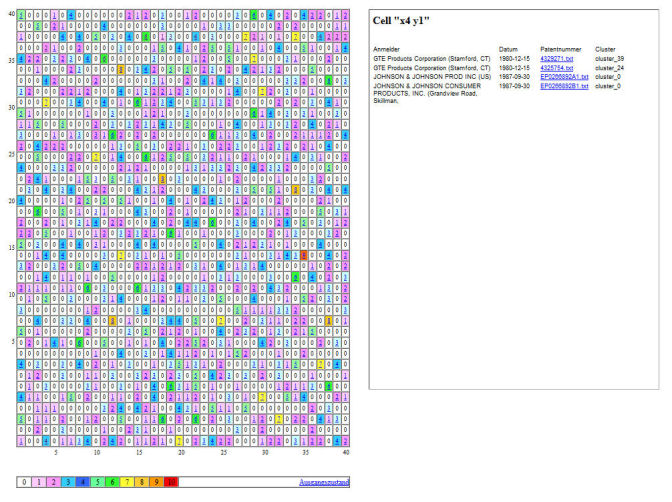
Isnstead of such a landscape we use a heatmap to show the result of a SOM clustering. The 2D-space is devided up into equal sized segments (as it is in case of the landscape) - shown as square cells. Each square contains a number reflecting the number of documents within this segment. Clicking on the number, associated document are shown on the right of the heatmap. To find a specific document you only have to click on "Patent list" below the heatmap, showing you (on the right) a sorted list of all documents together with their respective heatmap coordinates. Nice and useful.